ANNUAL REPORT PURSUANT TO SECTION 13 OR 15(d) OF THE SECURITIES EXCHANGE ACT OF 1934 |
TRANSITION REPORT PURSUANT TO SECTION 13 OR 15(d) OF THE SECURITIES EXCHANGE ACT OF 1934 |
(State or other jurisdiction of incorporation or organization) |
(I.R.S. Employer Identification No.) |
|
||
(Address of principal executive offices) |
(Zip Code) |
Title of each class: |
Trading Symbol(s): |
Name of each exchange on which registered: | ||
Large accelerated filer |
☒ |
Accelerated filer |
☐ | |||
Non-accelerated filer |
☐ | Smaller reporting company | ||||
Emerging growth company |
☐ |
• | the potential impacts of the COVID-19 pandemic on us; our Members, customers, and supply chain; and the world economy; |
• | our ability to attract and retain Members; |
• | our relationship with, and our ability to influence the actions of, our Members; |
• | our noncompliance with, or improper action by our employees or Members in violation of, applicable U.S. and foreign laws, rules, and regulations; |
• | adverse publicity associated with our Company or the direct-selling industry, including our ability to comfort the marketplace and regulators regarding our compliance with applicable laws; |
• | changing consumer preferences and demands; |
• | the competitive nature of our business and industry; |
• | legal and regulatory matters, including regulatory actions concerning, or legal challenges to, our products or network marketing program and product liability claims; |
• | the Consent Order entered into with the FTC, the effects thereof and any failure to comply therewith; |
• | risks associated with operating internationally and in China; |
• | our dependence on increased penetration of existing markets; |
• | any material disruption to our business caused by natural disasters, other catastrophic events, acts of war or terrorism, cybersecurity incidents, pandemics and/or other acts by third parties; |
• | noncompliance by us or our Members with any privacy laws, rules, or regulations or any security breach involving the misappropriation, loss, or other unauthorized use or disclosure of confidential information; |
• | contractual limitations on our ability to expand or change our direct-selling business model; |
• | our reliance on our information technology infrastructure and manufacturing facilities and those of our outside manufacturers; |
• | the sufficiency of our trademarks and other intellectual property; |
• | product concentration; |
• | our reliance upon, or the loss or departure of any member of, our senior management team; |
• | restrictions imposed by covenants in the agreements governing our indebtedness; |
• | risks related to our convertible notes; |
• | changes in, and uncertainties relating to, the application of transfer pricing, customs duties, value added taxes, and other tax laws, treaties, and regulations, or their interpretation; |
• | our incorporation under the laws of the Cayman Islands; and |
• | share price volatility related to, among other things, speculative trading and certain traders shorting our common shares. |
Item 1. |
Business |
Percentage of Net Sales |
||||||||||||||||
2020 |
2019 |
2018 |
Description |
Representative Products | ||||||||||||
Weight Management |
59.8 | % | 61.8 | % | 63.5 | % | Meal replacement, protein shakes, drink mixes, weight loss enhancers and healthy snacks | Formula 1 Healthy Meal, Herbal Tea Concentrate, Protein Drink Mix, Personalized Protein Powder, Total Control ® Prolessa ™ Duo | ||||||||
Targeted Nutrition |
27.6 | % | 26.2 | % | 25.4 | % | Functional beverages and dietary and nutritional supplements containing quality herbs, vitamins, minerals and other natural ingredients | Herbal Aloe Concentrate, Active Fiber Complex, Niteworks ® Herbalifeline ® | ||||||||
Energy, Sports, and Fitness |
7.9 | % | 7.2 | % | 6.3 | % | Products that support a healthy active lifestyle | Herbalife24 ® N-R-G Liftoff ® | ||||||||
Outer Nutrition |
2.0 | % | 2.0 | % | 1.9 | % | Facial skin care, body care, and hair care | Herbalife SKIN Herbal Aloe Bath and Body Care | ||||||||
Literature, Promotional, and Other |
2.7 | % | 2.8 | % | 2.9 | % | Start-up kits, sales tools, and educational materials |
Herbalife Member Packs and Biz Works |
Number of Sales Leaders |
Sales Leader Retention Rate |
|||||||||||||||||||||||
2020 |
2019 |
2018 |
2020 |
2019 |
2018 |
|||||||||||||||||||
North America |
71,202 | 66,264 | 49,379 | 65.4 | % | 73.2 | % | 65.9 | % | |||||||||||||||
Mexico |
72,866 | 75,475 | 71,719 | 66.6 | % | 69.9 | % | 66.3 | % | |||||||||||||||
South and Central America |
61,535 | 64,929 | 66,325 | 60.7 | % | 62.2 | % | 59.0 | % | |||||||||||||||
EMEA |
130,438 | 121,297 | 107,528 | 70.6 | % | 71.3 | % | 68.7 | % | |||||||||||||||
Asia Pacific |
158,815 | 133,817 | 114,818 | 65.7 | % | 64.4 | % | 59.0 | % | |||||||||||||||
|
|
|
|
|
|
|||||||||||||||||||
Total sales leaders |
494,856 | 461,782 | 409,769 | 66.5 | % | 67.9 | % | 63.6 | % | |||||||||||||||
China |
70,701 | 89,077 | 76,600 | |||||||||||||||||||||
|
|
|
|
|
|
|||||||||||||||||||
Worldwide total sales leaders |
565,557 | 550,859 | 486,369 | |||||||||||||||||||||
|
|
|
|
|
|
Item 1A. |
R isk Factors |
• | Our failure to establish and maintain Member and sales leader relationships could negatively impact sales of our products and materially harm our business, financial condition, and operating results. |
• | Because we cannot exert the same level of influence or control over our Members as we could if they were our employees, our Members could fail to comply with applicable law or our rules and procedures, which could result in claims against us that could materially harm our business, financial condition, and operating results. |
• | Adverse publicity associated with our Company or the direct-selling industry could materially harm our business, financial condition, and operating results. |
• | Our failure to compete successfully could materially harm our business, financial condition, and operating results. |
• | Since one of our products constitutes a significant portion of our net sales, significant decreases in consumer demand for this product or our failure to produce a suitable replacement, could materially harm our business, financial condition, and operating results. |
• | Our contractual obligation to sell our products only through our Herbalife Member network and to refrain from changing certain aspects of our Marketing Plan may limit our growth. |
• | Our failure to appropriately respond to changing consumer trends, preferences, and demand for new products and product enhancements could materially harm our Member relationships and our Members’ customer relationships and product sales or otherwise materially harm our business, financial condition, and operating results. |
• | If we fail to further penetrate existing markets, the growth in sales of our products, along with our operating results could be negatively impacted. |
• | Our business could be materially and adversely affected by natural disasters, other catastrophic events, acts of war or terrorism, cybersecurity incidents, pandemics, and/or other acts by third parties. |
• | We depend on the integrity and reliability of our information technology infrastructure, and any related interruptions or inadequacies may have a material adverse effect on our business, financial condition, and operating results. |
• | If any of our manufacturing facilities or third-party manufacturers fail to reliably supply products to us at required levels of quality or fail to comply with applicable laws, our financial condition and operating results could be materially and adversely impacted. |
• | If we lose the services of members of our senior management team, our business, financial condition, and operating results could be materially harmed. |
• | Our share price may be adversely affected by third parties who raise allegations about our Company. |
• | Our products are affected by extensive regulations, and our failure or our Members’ failure to comply with any regulations could lead to significant penalties or claims, which could materially harm our financial condition and operating results. |
• | Our network marketing program is subject to extensive regulation and scrutiny and any failure to comply, or alteration to our compensation practices in order to comply, with these regulations could materially harm our business, financial condition, and operating results. |
• | We are subject to the Consent Order with the FTC, the effects of which, or any failure to comply therewith, could materially harm our business, financial condition, and operating results. |
• | Our actual or perceived failure to comply with privacy and data protection laws, rules, and regulations could materially harm our business, financial condition, and operating results. |
• | We are subject to material product liability risks, which could increase our costs and materially harm our business, financial condition, and operating results. |
• | If we fail to protect our intellectual property, our ability to compete could be negatively affected, which could materially harm our financial condition and operating results. |
• | If we infringe the intellectual property rights of others, our business, financial condition, and operating results could be materially harmed. |
• | We may be held responsible for additional compensation, certain taxes, or assessments relating to the activities of our Members, which could materially harm our financial condition and operating results. |
• | A substantial portion of our business is conducted in foreign jurisdictions, exposing us to the risks associated with international operations. |
• | We are subject to the anti-bribery laws, rules, and regulations of the United States and the other foreign jurisdictions in which we operate. |
• | If we do not comply with transfer pricing, customs duties VAT, and similar regulations, we may be subject to additional taxes, customs duties, interest, and penalties in material amounts, which could materially harm our financial condition and operating results. |
• | Our business in China is subject to general, as well as industry-specific, economic, political, and legal developments and risks and requires that we utilize a modified version of the business model we use elsewhere in the world. |
• | The United Kingdom’s exit from the European Union could adversely impact us. |
• | The terms and covenants in our existing indebtedness could limit our discretion with respect to certain business matters, which could harm our business, financial condition, and operating results. |
• | The conversion or maturity of our convertible notes may adversely affect our financial condition and operating results, and their conversion into common shares could have a dilutive effect that could cause our share price to go down. |
• | Holders of our common shares may difficulties in protecting their interests because we are incorporated under Cayman Islands law. |
• | Provisions of our articles of association and Cayman Islands law may impede a takeover or make it more difficult for shareholders to change the direction or management of the Company, which could reduce shareholders’ opportunity to influence management of the Company. |
• | There is uncertainty as to shareholders’ ability to enforce certain foreign civil liabilities in the Cayman Islands. |
• | U.S. Tax Reform may adversely impact certain U.S. shareholders of the Company. |
• | the safety, quality, and efficacy of our products, as well as those of similar companies; |
• | our Members; |
• | our network marketing program or the attractiveness or viability of the financial opportunities it may provide; |
• | the direct-selling business generally; |
• | actual or purported failure by us or our Members to comply with applicable laws, rules, and regulations, including those regarding product claims and advertising, good manufacturing practices, the regulation of our network marketing program, the registration of our products for sale in our target markets or other aspects of our business; |
• | the security of our information technology infrastructure; and |
• | actual or alleged impropriety, misconduct, or fraudulent activity by any person formerly or currently associated with our Members or us. |
• | accurately anticipate consumer needs; |
• | innovate and develop new products and product enhancements that meet these needs; |
• | successfully commercialize new products and product enhancements; |
• | price our products competitively; |
• | manufacture and deliver our products in sufficient volumes and in a cost-effective and timely manner; and |
• | differentiate our product offerings from those of our competitors and successfully respond to other competitive pressures, including technological advancements, evolving industry standards, and changing regulatory requirements. |
• | pay dividends, redeem share capital or capital stock and make other restricted payments and investments; |
• | sell assets or merge, consolidate, or transfer all or substantially all of our subsidiaries’ assets; |
• | incur or guarantee additional debt; |
• | impose dividend or other distribution restrictions on our subsidiaries; and |
• | create liens on our and our subsidiaries’ assets. |
• | a company is acting or proposing to act illegally or outside the scope of its corporate authority; |
• | the act complained of, although not beyond the scope of the company’s corporate authority, could be effected only if authorized by more than the number of votes of the shareholders of the company actually obtained; or |
• | those who control the company are perpetrating a “fraud on the minority”. |
• | the company is not proposing to act illegally or beyond the scope of its corporate authority and the statutory provisions as to majority vote have been complied with; |
• | the shareholders who voted at the meeting in question fairly represent the relevant class of shareholders to which they belong; |
• | the scheme of arrangement is such as a businessman would reasonably approve; and |
• | the scheme of arrangement is not one that would more properly be sanctioned under some other provision of the Companies Act or that would amount to a “fraud on the minority.” |
Item 1B. |
Unresolv ed Staff Comments |
Item 2. |
Pr operties |
Item 3. |
Legal Proceedings |
Item 4. |
Mine Saf ety Disclosures |
Item 5. |
Market for Registrant ’ s Common Equity, Related Stockholder Matters and Issuer Purchases of Equity Securities |
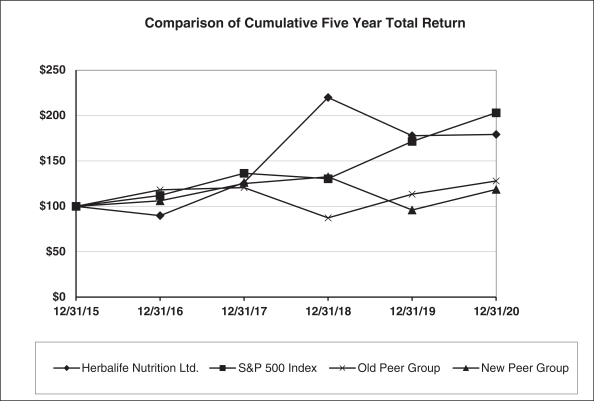
December 31, | ||||||||||||||||||||||||||||||
2015 |
2016 |
2017 |
2018 |
2019 |
2020 | |||||||||||||||||||||||||
Herbalife Nutrition Ltd. |
$ | 100.00 | $ | 89.78 | $ | 126.30 | $ | 219.88 | $ | 177.81 | $ | 179.22 | ||||||||||||||||||
S&P 500 Index |
$ | 100.00 | $ | 111.96 | $ | 136.40 | $ | 130.42 | $ | 171.49 | $ | 203.04 | ||||||||||||||||||
Old Peer Group(1) |
$ | 100.00 | $ | 118.17 | $ | 120.63 | $ | 87.26 | $ | 113.41 | $ | 127.94 | ||||||||||||||||||
New Peer Group(2) |
$ | 100.00 | $ | 106.12 | $ | 125.05 | $ | 132.58 | $ | 95.97 | $ | 118.65 |
(1) | The Old Peer Group consists of Avon Products, Inc., Conagra Brands, Inc., The Hain Celestial Group, Inc., Nu Skin Enterprises, Inc., Post Holdings, Inc., Tupperware Brands Corporation, and USANA Health Sciences, Inc. |
(2) | The New Peer Group consists of Conagra Brands, Inc., The Hain Celestial Group, Inc., Nu Skin Enterprises, Inc., Post Holdings, Inc., Tupperware Brands Corporation, and USANA Health Sciences, Inc. |
Total Number of Shares Purchased |
Average Price Paid per Share |
Total Number of Shares Purchased as Part of Publicly Announced Plans or Programs |
Approximate Dollar Value of Shares That May Yet Be Purchased Under the Plans or Programs | |||||||||||||||||
October 1 — October 31 |
— | $ | — | — | $ | 682,860,678 | ||||||||||||||
November 1 — November 30 |
947,800 | $ | 47.57 | 947,800 | $ | 637,778,537 | ||||||||||||||
December 1 — December 31 |
604,458 | $ | 49.43 | 604,458 | $ | 607,900,292 | ||||||||||||||
|
|
|
|
|||||||||||||||||
1,552,258 | $ | 48.29 | 1,552,258 | $ | 607,900,292 | |||||||||||||||
|
|
|
|
Item 6. |
Selecte d Financial Data |
Year Ended December 31, |
||||||||||||||||||||
2020 |
2019 |
2018 |
2017 |
2016 |
||||||||||||||||
(in millions, except per share amounts) |
||||||||||||||||||||
Income statement data: |
||||||||||||||||||||
Net sales |
$ | 5,541.8 | $ | 4,877.1 | $ | 4,891.8 | $ | 4,427.7 | $ | 4,488.4 | ||||||||||
Cost of sales |
1,150.6 | 958.0 | 919.3 | 848.6 | 854.6 | |||||||||||||||
|
|
|
|
|
|
|
|
|
|
|||||||||||
Gross profit |
4,391.2 | 3,919.1 | 3,972.5 | 3,579.1 | 3,633.8 | |||||||||||||||
Royalty overrides |
1,690.1 | 1,448.2 | 1,364.0 | 1,254.2 | 1,272.6 | |||||||||||||||
Selling, general, and administrative expenses |
2,075.0 | 1,940.3 | 1,955.2 | 1,758.6 | 1,966.9 | |||||||||||||||
Other operating income |
(14.5 | ) | (37.5 | ) | (29.8 | ) | (50.8 | ) | (63.8 | ) | ||||||||||
|
|
|
|
|
|
|
|
|
|
|||||||||||
Operating income |
640.6 | 568.1 | 683.1 | 617.1 | 458.1 | |||||||||||||||
Interest expense, net |
124.2 | 132.4 | 161.6 | 146.3 | 93.4 | |||||||||||||||
Other expense (income), net |
— | (15.7 | ) | 57.3 | (0.4 | ) | — | |||||||||||||
|
|
|
|
|
|
|
|
|
|
|||||||||||
Income before income taxes |
516.4 | 451.4 | 464.2 | 471.2 | 364.7 | |||||||||||||||
Income taxes(1) |
143.8 | 140.4 | 167.6 | 257.3 | 104.7 | |||||||||||||||
|
|
|
|
|
|
|
|
|
|
|||||||||||
Net income |
$ | 372.6 | $ | 311.0 | $ | 296.6 | $ | 213.9 | $ | 260.0 | ||||||||||
|
|
|
|
|
|
|
|
|
|
|||||||||||
Earnings per share: |
||||||||||||||||||||
Basic |
$ | 2.83 | $ | 2.26 | $ | 2.12 | $ | 1.35 | $ | 1.57 | ||||||||||
Diluted |
$ | 2.77 | $ | 2.20 | $ | 1.98 | $ | 1.29 | $ | 1.51 | ||||||||||
Weighted-average shares outstanding: |
||||||||||||||||||||
Basic |
131.5 | 137.4 | 140.2 | 158.5 | 166.1 | |||||||||||||||
Diluted |
134.5 | 141.6 | 149.5 | 165.7 | 172.2 | |||||||||||||||
Other financial data: |
||||||||||||||||||||
Net cash provided (used) by: |
||||||||||||||||||||
Operating activities |
628.6 | 457.5 | 648.4 | 590.8 | 367.3 | |||||||||||||||
Investing activities |
(123.2 | ) | (108.0 | ) | (83.9 | ) | (95.2 | ) | (142.4 | ) | ||||||||||
Financing activities |
(320.9 | ) | (713.0 | ) | (593.1 | ) | (85.2 | ) | (252.3 | ) | ||||||||||
Depreciation and amortization |
100.3 | 97.7 | 100.4 | 99.8 | 98.3 | |||||||||||||||
Capital expenditures(2) |
116.8 | 110.2 | 88.2 | 95.1 | 144.3 | |||||||||||||||
Balance sheet data: |
||||||||||||||||||||
Cash and cash equivalents |
$ | 1,045.4 | $ | 839.4 | $ | 1,198.9 | $ | 1,278.8 | $ | 844.0 | ||||||||||
Receivables, net of allowance for doubtful accounts |
83.3 | 79.7 | 70.5 | 93.3 | 70.3 | |||||||||||||||
Inventories |
501.4 | 436.2 | 381.8 | 341.2 | 371.3 | |||||||||||||||
Working capital |
648.5 | 523.8 | 216.2 | 953.5 | 671.0 | |||||||||||||||
Total assets |
3,076.1 | 2,678.6 | 2,789.8 | 2,895.1 | 2,565.4 | |||||||||||||||
Total debt |
2,428.4 | 1,803.0 | 2,453.8 | 2,268.1 | 1,447.9 | |||||||||||||||
Total shareholders’ (deficit) equity(3) |
(856.1 | ) | (390.0 | ) | (723.4 | ) | (334.7 | ) | 196.3 | |||||||||||
Dividends declared per share |
$ | — | $ | — | $ | — | $ | — | $ | — |
(1) | Income taxes for the years ended December 31, 2018 and 2017 include the impact of the U.S. Tax Reform enacted during the fourth quarter of 2017, as described further in Note 12, Income Taxes Exhibits, Financial Statement Schedules Form 10-K. |
(2) | Includes accrued capital expenditures. See the Consolidated Statements of Cash Flows included in Part IV, Item 15, Exhibits, Financial Statement Schedules 10-K for capital expenditures paid in cash during the years ended December 31, 2020, 2019, and 2018. |
(3) | During the year ended December 31, 2020, we did not pay any dividends and we repurchased 18.4 million of our common shares under our share repurchase program at an aggregate cost of approximately $892.1 million through open-market purchases and the modified Dutch auction tender offer that closed in August 2020. During the year ended December 31, 2019, we did not pay any dividends or repurchase any of our common shares through open market purchases. During the year ended December 31, 2018, we did not pay any dividends and we repurchased 11.4 million of our common shares under our share repurchase program at an aggregate cost of approximately $600.3 million through open-market purchases by an indirect wholly-owned subsidiary and the modified Dutch auction tender offer that closed in May 2018. During the year ended December 31, 2017, we did not pay any dividends and we repurchased 23.5 million of our common shares under our share repurchase program at an aggregate cost of approximately $795.3 million, inclusive of transaction costs and the issuance of the non-transferable contractual contingent value right, or CVR, through open-market purchases by an indirect wholly-owned subsidiary and the modified Dutch auction tender offer that closed in October 2017. During the year ended December 31, 2016, we did not pay any dividends or repurchase any of our common shares through open market purchases. Our share repurchase programs, the modified Dutch auction tender offers, and the CVR are discussed in greater detail in Part II, Item 7, Management’s Discussion and Analysis of Financial Condition and Results of Operations Shareholders’ Deficit Exhibits, Financial Statement Schedules Form 10-K. |
Item 7. |
Management ’ s Discussion and Analysis o f Financial Condition and Results of Operations |
• | North America; |
• | Mexico; |
• | South and Central America; |
• | EMEA, which consists of Europe, the Middle East, and Africa; |
• | Asia Pacific (excluding China); and |
• | China. |
• | Constrained ability to deliver product to Members and/or have Members pick product up from our access points due to facility closures and other precautionary measures we have implemented; |
• | Restrictions or outright prohibitions on in-person training and promotional meetings and events for Members that are a key aspect of our business model, such as our annual regional Extravaganzas; |
• | Constrained ability of Members to have face-to-face |
• | Slowed office operations as many of our employees have limited access to their regular place of employment. |
• | Adapting product access to the varying market-specific challenges, including shifting to more home product delivery from Member pick-up, and shifting to online or phone orders only from in-person ordering; |
• | Enhancing our training and promotion of technological tools offered to support Members’ online operations and accelerating the launch of certain functionalities, such as functions that facilitate our Members’ ability to communicate and transact with Nutrition Club customers; |
• | Members continuing to or increasing the ways they leverage the Internet and social media for customer contact including training, order-taking, and acceptance of payment; |
• | Member-operated Nutrition Clubs adding to or shifting from on-site offerings of single servings to carry-out and home delivery of single servings, as well as sales of fully packaged products; |
• | Instituting product purchase limitations for certain in-demand products to help ensure as many Members and their customers have fair access to these products and to minimize out-of-stock |
• | Physical changes at our major facilities, such as our manufacturing plants and distribution centers, including pre-entry temperature checks, face masks for employees, and plexiglass barriers, and employees working from home where possible rather than at company offices. |
Year Ended December 31, |
||||||||||||||||||||||||
2020 |
2019 |
% Change |
2019 |
2018 |
% Change |
|||||||||||||||||||
(Volume Points in millions) |
||||||||||||||||||||||||
North America(1) |
1,735.0 | 1,317.0 | 31.7 | % | 1,317.0 | 1,229.4 | 7.1 | % | ||||||||||||||||
Mexico |
879.7 | 882.8 | (0.4 | )% | 882.8 | 920.5 | (4.1 | )% | ||||||||||||||||
South and Central America(2) |
535.2 | 516.5 | 3.6 | % | 516.5 | 561.6 | (8.0 | )% | ||||||||||||||||
EMEA |
1,562.5 | 1,290.1 | 21.1 | % | 1,290.1 | 1,219.9 | 5.8 | % | ||||||||||||||||
Asia Pacific |
1,690.2 | 1,565.0 | 8.0 | % | 1,565.0 | 1,291.4 | 21.2 | % | ||||||||||||||||
China |
523.8 | 497.2 | 5.3 | % | 497.2 | 669.2 | (25.7 | )% | ||||||||||||||||
|
|
|
|
|
|
|
|
|||||||||||||||||
Worldwide(3) |
6,926.4 | 6,068.6 | 14.1 | % | 6,068.6 | 5,892.0 | 3.0 | % | ||||||||||||||||
|
|
|
|
|
|
|
|
(1) | Excluding Volume Point adjustments made during 2018 for certain products in certain markets, the percent change for the year ended December 31, 2019 would have been an increase of 6.2%. |
(2) | Excluding Volume Point adjustments made during 2018 for certain products in certain markets, the percent change for the year ended December 31, 2019 would have been a decrease of 8.6%. |
(3) | Excluding the Volume Point adjustments made during 2018 for certain products in certain markets in the North America and South and Central America regions noted above, the percent change for the year ended December 31, 2019 would have been an increase of 2.8%. |
• | royalty overrides and production bonuses; |
• | the Mark Hughes bonus payable to some of our most senior Members; and |
• | other discretionary incentive cash bonuses to qualifying Members. |
Year Ended December 31, |
||||||||||||
2020 |
2019 |
2018 |
||||||||||
Operations: |
||||||||||||
Net sales |
100.0 | % | 100.0 | % | 100.0 | % | ||||||
Cost of sales |
20.8 | 19.6 | 18.8 | |||||||||
|
|
|
|
|
|
|||||||
Gross profit |
79.2 | 80.4 | 81.2 | |||||||||
Royalty overrides(1) |
30.5 | 29.7 | 27.9 | |||||||||
Selling, general, and administrative expenses(1) |
37.4 | 39.8 | 39.9 | |||||||||
Other operating income |
(0.3 | ) | (0.8 | ) | (0.6 | ) | ||||||
|
|
|
|
|
|
|||||||
Operating income |
11.6 | 11.7 | 14.0 | |||||||||
Interest expense |
2.5 | 3.1 | 3.7 | |||||||||
Interest income |
0.2 | 0.4 | 0.4 | |||||||||
Other expense (income), net |
— | (0.3 | ) | 1.2 | ||||||||
|
|
|
|
|
|
|||||||
Income before income taxes |
9.3 | 9.3 | 9.5 | |||||||||
Income taxes |
2.6 | 2.9 | 3.4 | |||||||||
|
|
|
|
|
|
|||||||
Net income |
6.7 | % | 6.4 | % | 6.1 | % | ||||||
|
|
|
|
|
|
(1) | Service fees to our independent service providers in China are included in selling, general, and administrative expenses while Member compensation for all other countries is included in Royalty overrides. |
Year Ended December 31, | |||||||||||||||
2020 |
2019 |
% Change | |||||||||||||
(Dollars in millions) |
|||||||||||||||
North America |
$ | 1,372.9 | $ | 1,025.5 | 33.9 | % | |||||||||
Mexico |
436.9 | 473.6 | (7.7 | )% | |||||||||||
South and Central America |
366.4 | 379.0 | (3.3 | )% | |||||||||||
EMEA |
1,208.3 | 998.0 | 21.1 | % | |||||||||||
Asia Pacific |
1,347.7 | 1,249.0 | 7.9 | % | |||||||||||
China |
809.6 | 752.0 | 7.7 | % | |||||||||||
|
|
|
|
||||||||||||
Worldwide |
$ | 5,541.8 | $ | 4,877.1 | 13.6 | % | |||||||||
|
|
|
|
Year Ended December 31, |
||||||||||||
2020 |
2019 |
% Change |
||||||||||
(Dollars in millions) |
||||||||||||
Weight Management |
$ | 3,312.8 | $ | 3,012.5 | 10.0 | % | ||||||
Targeted Nutrition |
1,527.4 | 1,278.5 | 19.5 | % | ||||||||
Energy, Sports, and Fitness |
437.4 | 352.0 | 24.3 | % | ||||||||
Outer Nutrition |
111.3 | 97.3 | 14.4 | % | ||||||||
Literature, Promotional, and Other(1) |
152.9 | 136.8 | 11.8 | % | ||||||||
|
|
|
|
|||||||||
Total |
$ | 5,541.8 | $ | 4,877.1 | 13.6 | % | ||||||
|
|
|
|
(1) | Product buybacks and returns in all product categories are included in the literature, promotional, and other category. |
Year Ended December 31, |
||||||||
2020 |
2019 |
|||||||
(in millions) |
||||||||
Interest expense |
$ | 133.0 | $ | 153.0 | ||||
Interest income |
(8.8 | ) | (20.6 | ) | ||||
|
|
|
|
|||||
Interest expense, net |
$ | 124.2 | $ | 132.4 | ||||
|
|
|
|
Payments Due by Period |
||||||||||||||||||||
Total |
2021 |
2022 - 2023 |
2024 - 2025 |
2026 & Thereafter |
||||||||||||||||
(in millions) |
||||||||||||||||||||
Convertible senior notes due 2024 |
600.5 | 14.4 | 28.9 | 557.2 | — | |||||||||||||||
Senior notes due 2025 |
848.5 | 59.3 | 94.5 | 694.7 | — | |||||||||||||||
Senior notes due 2026 |
574.0 | 29.0 | 58.0 | 58.0 | 429.0 | |||||||||||||||
Borrowings under the senior secured credit facility(1) |
1,106.8 | 48.9 | 108.8 | 949.1 | — | |||||||||||||||
Operating leases |
329.0 | 45.8 | 85.8 | 60.7 | 136.7 | |||||||||||||||
Purchase obligations and other commitments |
251.2 | 225.5 | 24.9 | 0.8 | — | |||||||||||||||
|
|
|
|
|
|
|
|
|
|
|||||||||||
Total(2) |
$ | 3,710.0 | $ | 422.9 | $ | 400.9 | $ | 2,320.5 | $ | 565.7 | ||||||||||
|
|
|
|
|
|
|
|
|
|
(1) | The estimated interest payments on our 2018 Credit Facility are based on interest rates effective as of December 31, 2020. |
(2) | Our consolidated balance sheet as of December 31, 2020 includes $60.1 million in unrecognized tax benefits. The future payments related to these unrecognized tax benefits have not been presented in the table above due to the uncertainty of the amounts and potential timing of cash settlements with the tax authorities and whether any settlement would occur. |
Quarter Ended | ||||||||||||||||||||||||||||||||||||||||
December 31, 2020 |
September 30, 2020 |
June 30, 2020 |
March 31, 2020 |
December 31, 2019(1) |
September 30, 2019 |
June 30, 2019 |
March 31, 2019 | |||||||||||||||||||||||||||||||||
(in millions, except per share amounts) | ||||||||||||||||||||||||||||||||||||||||
Net sales |
$ | 1,410.7 | $ | 1,521.8 | $ | 1,346.9 | $ | 1,262.4 | $ | 1,220.3 | $ | 1,244.5 | $ | 1,240.1 | $ | 1,172.2 | ||||||||||||||||||||||||
Cost of sales |
309.4 | 322.7 | 272.8 | 245.7 | 229.8 | 243.4 | 243.2 | 241.6 | ||||||||||||||||||||||||||||||||
|
|
|
|
|
|
|
|
|
|
|
|
|
|
|
|
|||||||||||||||||||||||||
Gross profit |
1,101.3 | 1,199.1 | 1,074.1 | 1,016.7 | 990.5 | 1,001.1 | 996.9 | 930.6 | ||||||||||||||||||||||||||||||||
Royalty overrides |
438.9 | 463.1 | 406.9 | 381.2 | 358.1 | 363.8 | 366.8 | 359.5 | ||||||||||||||||||||||||||||||||
Selling, general, and administrative expenses |
515.5 | 529.7 | 480.8 | 549.0 | 527.8 | 500.1 | 477.0 | 435.4 | ||||||||||||||||||||||||||||||||
Other operating income |
(1.5 | ) | (0.6 | ) | (3.3 | ) | (9.1 | ) | (3.8 | ) | (6.4 | ) | — | (27.3 | ) | |||||||||||||||||||||||||
|
|
|
|
|
|
|
|
|
|
|
|
|
|
|
|
|||||||||||||||||||||||||
Operating income |
148.4 | 206.9 | 189.7 | 95.6 | 108.4 | 143.6 | 153.1 | 163.0 | ||||||||||||||||||||||||||||||||
Interest expense, net |
35.2 | 35.2 | 28.8 | 25.0 | 28.4 | 31.6 | 36.3 | 36.1 | ||||||||||||||||||||||||||||||||
Other expense (income), net |
— | — | — | — | — | (1.3 | ) | (5.9 | ) | (8.5 | ) | |||||||||||||||||||||||||||||
|
|
|
|
|
|
|
|
|
|
|
|
|
|
|
|
|||||||||||||||||||||||||
Income before income taxes |
113.2 | 171.7 | 160.9 | 70.6 | 80.0 | 113.3 | 122.7 | 135.4 | ||||||||||||||||||||||||||||||||
Income taxes |
39.4 | 33.6 | 45.8 | 25.0 | 23.3 | 31.8 | 46.2 | 39.1 | ||||||||||||||||||||||||||||||||
|
|
|
|
|
|
|
|
|
|
|
|
|
|
|
|
|||||||||||||||||||||||||
Net income |
$ | 73.8 | $ | 138.1 | $ | 115.1 | $ | 45.6 | $ | 56.7 | $ | 81.5 | $ | 76.5 | $ | 96.3 | ||||||||||||||||||||||||
|
|
|
|
|
|
|
|
|
|
|
|
|
|
|
|
|||||||||||||||||||||||||
Earnings per share: |
||||||||||||||||||||||||||||||||||||||||
Basic |
$ | 0.61 | $ | 1.07 | $ | 0.84 | $ | 0.33 | $ | 0.41 | $ | 0.59 | $ | 0.56 | $ | 0.70 | ||||||||||||||||||||||||
Diluted |
$ | 0.59 | $ | 1.04 | $ | 0.82 | $ | 0.32 | $ | 0.40 | $ | 0.58 | $ | 0.54 | $ | 0.66 | ||||||||||||||||||||||||
Weighted-average shares outstanding: |
||||||||||||||||||||||||||||||||||||||||
Basic |
121.3 | 129.2 | 137.9 | 137.8 | 137.5 | 137.4 | 137.4 | 137.1 | ||||||||||||||||||||||||||||||||
Diluted |
124.3 | 132.5 | 140.1 | 140.2 | 140.8 | 140.0 | 142.4 | 145.5 |
(1) | The fourth quarter of 2019 includes a net favorable adjustment to our unrecognized tax benefit liability of $11.4 million primarily attributable to transfer pricing matters in various foreign jurisdictions, and a legal accrual of $40 million relating to the SEC and DOJ investigations relating to the FCPA matter in China as described further in Note 7, Contingencies Exhibits, Financial Statement Schedules Form 10-K. |
Item 7A. |
Quantitative and Qualitat ive Disclosures About Market Risk |
Item 8. |
Financial Stateme nts and Supplementary Data |
Item 9. |
Changes in and Disagreements With Accountants on Accounting and Financial Disclosure |
Item 9A. |
Controls and Procedures |
Item 9B. |
Other Information |
Item 10. |
Directors, Executive Officers and Corporate Governance |
Item 11. |
Executive Compensation |
Item 12. |
Security Ownership of Certain Beneficial Owners and Management and Related Stockholder Matters |
Item 13. |
Certain Relationships and Related Transactions, and Director Independence |
Item 14. |
Principal Accountant Fees and Services |
Item 15. |
Exhibits, Financial Statement Schedules |
Page No. | |||||
HERBALIFE NUTRITION LTD. AND SUBSIDIARIES |
|||||
90 | |||||
93 | |||||
94 | |||||
95 | |||||
96 | |||||
97 | |||||
98 |
Exhibit Number |
Description |
Reference |
||||
101.SCH | Inline XBRL Taxonomy Extension Schema Document | * | ||||
101.CAL | Inline XBRL Taxonomy Extension Calculation Linkbase Document | * | ||||
101.DEF | Inline XBRL Taxonomy Extension Definition Linkbase Document | * | ||||
101.LAB | Inline XBRL Taxonomy Extension Label Linkbase Document | * | ||||
101.PRE | Inline XBRL Taxonomy Extension Presentation Linkbase Document | * | ||||
104 | Cover Page Interactive Data File – The cover page from the Company’s Annual Report on Form 10-K for the year ended December 31, 2020 is formatted in Inline XBRL (included as Exhibit 101) |
* |
* | Filed herewith. |
** | Furnished herewith. |
# | Management contract or compensatory plan or arrangement. |
(a) | Previously filed on October 1, 2004 as an Exhibit to the Company’s registration statement on Form S-1 (File No. 333-119485) and is incorporated herein by reference. |
(b) | Previously filed on December 2, 2004 as an Exhibit to Amendment No. 4 to the Company’s registration statement on Form S-1 (File No. 333-119485) and is incorporated herein by reference. |
(c) | Previously filed on December 14, 2004 as an Exhibit to Amendment No. 5 to the Company’s registration statement on Form S-1 (File No. 333-119485) and is incorporated herein by reference. |
(d) | Previously filed on May 5, 2015 as an Exhibit to the Company’s Quarterly Report on Form 10-Q for the quarter ended March 31, 2015 and is incorporated herein by reference. |
(e) | Previously filed on August 5, 2015 as an Exhibit to the Company’s Quarterly Report on Form 10-Q for the quarter ended June 30, 2015 and is incorporated herein by reference. |
(f) | Previously filed on May 5, 2016 as an Exhibit to the Company’s Quarterly Report on Form 10-Q for the quarter ended March 31, 2016 and is incorporated herein by reference. |
(g) | Previously filed on July 15, 2016 as an Exhibit to the Company’s Current Report on Form 8-K and is incorporated herein by reference. |
(h) | Previously filed on February 23, 2017 as an Exhibit to the Company’s Annual Report on Form 10-K for the year ended December 31, 2016 and is incorporated herein by reference. |
(i) | Previously filed on August 1, 2017 as an Exhibit to the Company’s Quarterly Report on Form 10-Q for the quarter ended June 30, 2017 and is incorporated herein by reference. |
(j) | Previously filed on August 21, 2017 as an Exhibit to the Company’s Tender Offer Statement on Schedule TO and is incorporated herein by reference. |
(k) | Previously filed on February 22, 2018 as an Exhibit to the Company’s Annual Report on Form 10-K for the year ended December 31, 2017 and is incorporated herein by reference. |
(l) | Previously filed on March 29, 2018 as an Exhibit to the Company’s Current Report on Form 8-K and is incorporated herein by reference. |
(m) | Previously filed on May 3, 2018 as an Exhibit to the Company’s Quarterly Report on Form 10-Q for the quarter ended March 31, 2018 and is incorporated herein by reference. |
(n) | Previously filed on August 22, 2018 as an Exhibit to the Company’s Current Report on Form 8-K and is incorporated herein by reference. |
(o) | Previously filed on February 19, 2019 as an Exhibit to the Company’s Annual Report on Form 10-K for the year ended December 31, 2018 and is incorporated herein by reference. |
(p) | Previously filed on August 1, 2019 as an Exhibit to the Company’s Quarterly Report on Form 10-Q for the quarter ended June 30, 2019 and is incorporated herein by reference. |
(q) | Previously filed on October 29, 2019 as an Exhibit to the Company’s Quarterly Report on Form 10-Q for the quarter ended September 30, 2019 and is incorporated herein by reference. |
(r) | Previously filed on December 12, 2019 as an Exhibit to the Company’s Current Report on Form 8-K and is incorporated herein by reference. |
(s) | Previously filed on February 18, 2020 as an Exhibit to the Company’s Annual Report on Form 10-K for the year ended December 31, 2019. |
(t) | Previously filed on March 19, 2020 as an Exhibit to the Company’s Current Report on Form 8-K and is incorporated herein by reference. |
(u) | Previously filed on May 7, 2020 as an Exhibit to the Company’s Quarterly Report on Form 10-Q for the quarter ended March 31, 2020 and is incorporated herein by reference. |
(v) | Previously filed on May 29, 2020 as an Exhibit to the Company’s Current Report on Form 8-K and is incorporated herein by reference. |
(w) | Previously filed on November 5, 2020 as an Exhibit to the Company’s Quarterly Report on Form 10-Q for the quarter ended September 30, 2020 and is incorporated herein by reference. |
(x) | Previously filed on November 5, 2020 as an Exhibit to the Company’s Current Report on Form 8-K and is incorporated herein by reference. |
(y) | Previously filed on January 4, 2021 as an Exhibit to the Company’s Current Report on Form 8-K and is incorporated herein by reference. |
(z) | Previously filed on February 11, 2021 as an Exhibit to the Company’s Current Report on Form 8-K and is incorporated herein by reference. |
December 31, | ||||||||||
2020 |
2019 | |||||||||
(in millions, except share and par value amounts) | ||||||||||
ASSETS |
||||||||||
Current assets: |
||||||||||
Cash and cash equivalents |
|
$ | |
$ | ||||||
Receivables, net of allowance for doubtful accounts |
|
|
||||||||
Inventories |
|
|
||||||||
Prepaid expenses and other current assets |
|
|
||||||||
|
|
|
|
|
|
|||||
Total current assets |
|
|
||||||||
|
|
|
|
|
|
|||||
Property, plant, and equipment, at cost, net of accumulated depreciation and amortization |
|
|
||||||||
Operating lease right-of-use |
|
|
||||||||
Marketing-related intangibles and other intangible assets, net |
|
|
||||||||
Goodwill |
|
|
||||||||
Other assets |
|
|
||||||||
|
|
|
|
|
|
|||||
Total assets |
|
$ | |
$ | ||||||
|
|
|
|
|
|
|||||
LIABILITIES AND SHAREHOLDERS’ DEFICIT |
||||||||||
Current liabilities: |
||||||||||
Accounts payable |
|
$ | |
$ | ||||||
Royalty overrides |
|
|
||||||||
Current portion of long-term debt |
|
|
||||||||
Other current liabilities |
|
|
||||||||
|
|
|
|
|
|
|||||
Total current liabilities |
|
|
||||||||
|
|
|
|
|
|
|||||
Long-term debt, net of current portion |
|
|
||||||||
Non-current operating lease liabilities |
|
|
||||||||
Other non-current liabilities |
|
|
||||||||
|
|
|
|
|
|
|||||
Total liabilities |
|
|
||||||||
|
|
|
|
|
|
|||||
Commitments and contingencies |
||||||||||
Shareholders’ deficit: |
||||||||||
Common shares, $ b illion shares authorized; |
|
|
||||||||
Paid-in capital in excess of par value |
|
|
||||||||
Accumulated other comprehensive loss |
|
( |
) | |
( |
) | ||||
Accumulated deficit |
|
( |
) | |
( |
) | ||||
Treasury stock, at cost, |
|
( |
) | |
( |
) | ||||
|
|
|
|
|
|
|||||
Total shareholders’ deficit |
|
( |
) | |
( |
) | ||||
|
|
|
|
|
|
|||||
Total liabilities and shareholders’ deficit |
|
$ |
|
$ |
||||||
|
|
|
|
|
|
Year Ended December 31, |
||||||||||||
2020 |
2019 |
2018 |
||||||||||
(in millions, except per share amounts) |
||||||||||||
Net sales |
$ | $ | $ | |||||||||
Cost of sales |
||||||||||||
|
|
|
|
|
|
|||||||
Gross profit |
||||||||||||
Royalty overrides |
||||||||||||
Selling, general, and administrative expenses |
||||||||||||
Other operating income |
( |
) | ( |
) | ( |
) | ||||||
|
|
|
|
|
|
|||||||
Operating income |
||||||||||||
Interest expense |
||||||||||||
Interest income |
||||||||||||
Other expense (income), net |
— | ( |
) | |||||||||
|
|
|
|
|
|
|||||||
Income before income taxes |
||||||||||||
Income taxes |
||||||||||||
|
|
|
|
|
|
|||||||
Net income |
$ | $ | $ | |||||||||
|
|
|
|
|
|
|||||||
Earnings per share: |
||||||||||||
Basic |
$ | $ | $ | |||||||||
Diluted |
$ | $ | $ | |||||||||
Weighted-average shares outstanding: |
||||||||||||
Basic |
||||||||||||
Diluted |
Year Ended December 31, |
||||||||||||
2020 |
2019 |
2018 |
||||||||||
(in millions) |
||||||||||||
Net income |
$ | $ | $ | |||||||||
Other comprehensive income (loss): |
||||||||||||
Foreign currency translation adjustment, net of income taxes of $( |
— | ( |
) | |||||||||
Unrealized loss on derivatives, net of income taxes of $( |
( |
) | ( |
) | ( |
) | ||||||
|
|
|
|
|
|
|||||||
Total other comprehensive income (loss) |
( |
) | ( |
) | ||||||||
|
|
|
|
|
|
|||||||
Total comprehensive income |
$ | $ | $ | |||||||||
|
|
|
|
|
|
Common Shares |
Treasury Stock |
Paid-in Capital in Excess of Par Value |
Accumulated Other Comprehensive Loss |
Accumulated Deficit |
Total Shareholders’ Deficit | |||||||||||||||||||||||||
|
|
|
(in millions) |
|
|
|||||||||||||||||||||||||
Balance as of December 31, 2017 |
|
$ | |
$ | ( |
) | |
$ | |
$ | ( |
) | |
$ | ( |
) | |
$ | ( |
) | ||||||||||
Issuance of |
|
— | |
|
|
|
|
|||||||||||||||||||||||
Additional capital from share-based compensation |
|
|
|
|
|
|
||||||||||||||||||||||||
Repurchases of |
|
— | |
( |
) | |
( |
) | |
|
( |
) | |
( |
) | |||||||||||||||
Forward Counterparties’ delivery of |
|
|
|
— | |
|
|
— | ||||||||||||||||||||||
Issuance of convertible senior notes |
|
|
|
|
|
|
||||||||||||||||||||||||
Repayment of convertible senior notes |
|
|
|
( |
) | |
|
|
( |
) | ||||||||||||||||||||
Unwind of capped call transactions |
|
|
|
|
|
|
||||||||||||||||||||||||
Net income |
|
|
|
|
|
|
||||||||||||||||||||||||
Foreign currency translation adjustment, net of income taxes of $( |
|
|
|
|
( |
) | |
|
( |
) | ||||||||||||||||||||
Unrealized loss on derivatives, net of income taxes of $ |
|
|
|
|
( |
) | |
|
( |
) | ||||||||||||||||||||
Cumulative effect of accounting change |
|
|
|
|
|
( |
) | |
( |
) | ||||||||||||||||||||
|
|
|
|
|
|
|
|
|
|
|
|
|
|
|
|
|
|
|||||||||||||
Balance as of December 31, 2018 |
|
|
( |
) | |
|
( |
) | |
( |
) | |
( |
) | ||||||||||||||||
Issuance of |
|
— | |
|
|
|
|
|||||||||||||||||||||||
Additional capital from share-based compensation |
|
|
|
|
|
|
||||||||||||||||||||||||
Repurchases of |
|
— | |
|
( |
) | |
|
|
( |
) | |||||||||||||||||||
Forward Counterparties’ delivery of |
|
— | |
|
— | |
|
|
— | |||||||||||||||||||||
Net income |
|
|
|
|
|
|
||||||||||||||||||||||||
Foreign currency translation adjustment, net of income taxes of $ |
|
|
|
|
— | |
|
— | ||||||||||||||||||||||
Unrealized loss on derivatives, net of income taxes of $ |
|
|
|
|
( |
) | |
|
( |
) | ||||||||||||||||||||
|
|
|
|
|
|
|
|
|
|
|
|
|
|
|
|
|
|
|||||||||||||
Balance as of December 31, 2019 |
|
|
( |
) | |
|
( |
) | |
( |
) | |
( |
) | ||||||||||||||||
Issuance of |
|
— | |
|
|
|
|
|||||||||||||||||||||||
Additional capital from share-based compensation |
|
|
|
|
|
|
||||||||||||||||||||||||
Repurchases of |
|
— | |
|
( |
) | |
|
( |
) | |
( |
) | |||||||||||||||||
Net income |
|
|
|
|
|
|
||||||||||||||||||||||||
Foreign currency translation adjustment, net of income taxes of $( |
|
|
|
|
|
|
||||||||||||||||||||||||
Unrealized loss on derivatives, net of income taxes of $( |
|
|
|
|
( |
) | |
|
( |
) | ||||||||||||||||||||
|
|
|
|
|
|
|
|
|
|
|
|
|
|
|
|
|
|
|||||||||||||
Balance as of December 31, 2020 |
|
$ | |
$ | ( |
) | |
$ | |
$ | ( |
) | |
$ | ( |
) | |
$ | ( |
) | ||||||||||
|
|
|
|
|
|
|
|
|
|
|
|
|
|
|
|
|
|
Year Ended December 31, |
||||||||||||
2020 |
2019 |
2018 |
||||||||||
(in millions) |
||||||||||||
Cash flows from operating activities: |
||||||||||||
Net income |
$ | $ | $ | |||||||||
Adjustments to reconcile net income to net cash provided by operating activities: |
||||||||||||
Depreciation and amortization |
||||||||||||
Share-based compensation expenses |
||||||||||||
Non-cash interest expense |
||||||||||||
Deferred income taxes |
( |
) | ||||||||||
Inventory write-downs |
||||||||||||
Foreign exchange transaction loss |
||||||||||||
Loss on extinguishment of debt |
— | — | ||||||||||
Other |
( |
) | ||||||||||
Changes in operating assets and liabilities: |
||||||||||||
Receivables |
( |
) | ( |
) | ||||||||
Inventories |
( |
) | ( |
) | ( |
) | ||||||
Prepaid expenses and other current assets |
( |
) | ( |
) | ||||||||
Accounts payable |
||||||||||||
Royalty overrides |
||||||||||||
Other current liabilities |
( |
) | ||||||||||
Other |
( |
) | ( |
) | ||||||||
|
|
|
|
|
|
|||||||
Net cash provided by operating activities |
||||||||||||
|
|
|
|
|
|
|||||||
Cash flows from investing activities: |
||||||||||||
Purchases of property, plant, and equipment |
( |
) | ( |
) | ( |
) | ||||||
Other |
( |
) | ( |
) | ||||||||
|
|
|
|
|
|
|||||||
Net cash used in investing activities |
( |
) | ( |
) | ( |
) | ||||||
|
|
|
|
|
|
|||||||
Cash flows from financing activities: |
||||||||||||
Borrowings from senior secured credit facility and other debt, net of discount |
— | |||||||||||
Principal payments on senior secured credit facility and other debt |
( |
) | ( |
) | ( |
) | ||||||
Proceeds from convertible senior notes |
— | — | ||||||||||
Repayment of convertible senior notes |
— | ( |
) | ( |
) | |||||||
Proceeds from senior notes |
— | |||||||||||
Debt issuance costs |
( |
) | — | ( |
) | |||||||
Share repurchases |
( |
) | ( |
) | ( |
) | ||||||
Proceeds from settlement of capped call transactions |
— | — | ||||||||||
Other |
||||||||||||
|
|
|
|
|
|
|||||||
Net cash used in financing activities |
( |
) | ( |
) | ( |
) | ||||||
|
|
|
|
|
|
|||||||
Effect of exchange rate changes on cash, cash equivalents, and restricted cash |
( |
) | ( |
) | ||||||||
|
|
|
|
|
|
|||||||
Net change in cash, cash equivalents, and restricted cash |
( |
) | ( |
) | ||||||||
Cash, cash equivalents, and restricted cash, beginning of period |
||||||||||||
|
|
|
|
|
|
|||||||
Cash, cash equivalents, and restricted cash, end of period |
$ | $ | $ | |||||||||
|
|
|
|
|
|
|||||||
Cash paid during the year: |
||||||||||||
Interest paid |
$ | $ | $ | |||||||||
|
|
|
|
|
|
|||||||
Income taxes paid |
$ | $ | $ | |||||||||
|
|
|
|
|
|
• | The carrying amounts of cash and cash equivalents, receivables and accounts payable approximate fair value due to the short-term maturities of these instruments; |
• | The fair value of option and forward contracts are based on dealer quotes; |
• | The Company’s variable-rate revolving credit facility is recorded at carrying value and is considered to approximate its fair value; |
• | The outstanding borrowings on the Company’s term loan A under its senior secured credit facility are recorded at carrying value, and their fair value is determined by utilizing over-the-counter |
• | The outstanding borrowings on the Company’s term loan B under its senior secured credit facility are recorded at carrying value, and their fair value is determined by utilizing over-the-counter |
• | The Company’s convertible senior notes are recorded at carrying value and their fair value is determined using two valuation methods as described further in Note 5, Long-Term Debt |
• | The Company’s senior notes issued in August 2018, or the 2026 Notes, and senior notes issued in May 2020, or the 2025 Notes, are recorded at carrying value, and their fair values are determined by utilizing over-the-counter |
December 31, |
||||||||
2020 |
2019 |
|||||||
(in millions) |
||||||||
Property, plant, and equipment, at cost: |
||||||||
Land and buildings |
$ | $ | ||||||
Furniture and fixtures |
||||||||
Equipment |
||||||||
Building and leasehold improvements |
||||||||
|
|
|
|
|||||
Total property, plant, and equipment, at cost |
||||||||
Less: accumulated depreciation and amortization |
( |
) | ( |
) | ||||
|
|
|
|
|||||
Property, plant, and equipment, at cost, net of accumulated depreciation and amortization |
$ | $ | ||||||
|
|
|
|
December 31, |
||||||||
2020 |
2019 |
|||||||
(in millions) |
||||||||
Cash and cash equivalents |
$ | $ | ||||||
Restricted cash included in Prepaid expenses and other current assets |
||||||||
Restricted cash included in Other assets |
||||||||
|
|
|
|
|||||
Total cash, cash equivalents, and restricted cash shown in the statement of cash flows |
$ | $ | ||||||
|
|
|
|
Year Ended December 31, |
||||||||||||
2020 |
2019 |
2018 |
||||||||||
(in millions) |
||||||||||||
Weighted-average shares used in basic computations |
||||||||||||
Dilutive effect of exercise of equity grants outstanding |
||||||||||||
Dilutive effect of 2019 Convertible Notes |
— | |||||||||||
|
|
|
|
|
|
|||||||
Weighted-average shares used in diluted computations |
||||||||||||
|
|
|
|
|
|
December 31, |
||||||||
2020 |
2019 |
|||||||
(in millions) |
||||||||
Raw materials |
$ | $ | ||||||
Work in process |
||||||||
Finished goods |
||||||||
|
|
|
|
|||||
Total |
$ | $ | ||||||
|
|
|
|
December 31, |
||||||||||
2020 |
2019 |
Balance Sheet Location | ||||||||
(in millions) |
||||||||||
ASSETS: |
||||||||||
Operating lease right-of-use |
$ | $ | ||||||||
Finance lease right-of-use |
||||||||||
|
|
|
|
|
||||||
Total lease assets |
$ | $ | ||||||||
|
|
|
|
|
||||||
LIABILITIES: |
||||||||||
Current: |
||||||||||
Operating lease liabilities |
$ | $ | ||||||||
Finance lease liabilities |
||||||||||
Non-current: |
||||||||||
Operating lease liabilities |
||||||||||
Finance lease liabilities |
||||||||||
|
|
|
|
|
||||||
Total lease liabilities |
$ | $ | ||||||||
|
|
|
|
|
(1) | Finance lease assets are recorded net of accumulated amortization of $ |
Year Ended December 31, | ||||||||||
2020 |
2019 | |||||||||
(in millions) | ||||||||||
Operating lease cost(1)(2) |
$ |
$ |
||||||||
Finance lease cost |
||||||||||
Amortization of right-of-use |
||||||||||
Interest on lease liabilities |
||||||||||
|
|
|
|
|||||||
Net lease cost |
$ |
$ |
||||||||
|
|
|
|
(1) | Includes short-term leases and variable lease costs, which were $ right-of-use |
(2) | Amount includes $ Leases |
Operating Leases(1) |
Finance Leases | |||||||||
(in millions) | ||||||||||
2021 |
$ |
$ |
||||||||
2022 |
||||||||||
2023 |
||||||||||
2024 |
— |
|||||||||
2025 |
— |
|||||||||
Thereafter |
— |
|||||||||
|
|
|
|
|||||||
Total lease payments |
||||||||||
Less: imputed interest |
— |
|||||||||
|
|
|
|
|||||||
Present value of lease liabilities |
$ |
$ |
||||||||
|
|
|
|
(1) | Operating lease payments exclude $ |
December 31, |
||||||||
2020 |
2019 |
|||||||
Weighted-average remaining lease term: |
||||||||
Operating leases |
||||||||
Finance leases |
||||||||
Weighted-average discount rate: |
||||||||
Operating leases |
% | % | ||||||
Finance leases |
% | % |
Year Ended December 31, | ||||||||||
2020 |
2019 | |||||||||
(in millions) | ||||||||||
Cash paid for amounts included in the measurement of lease liabilities: |
||||||||||
Operating cash flows for operating leases |
$ | $ | ||||||||
Operating cash flows for finance lease s |
||||||||||
Financing cash flows for finance leases |
||||||||||
Right-of-use |
||||||||||
Operating leases |
||||||||||
Finance leases |
December 31, |
||||||||
2020 |
2019 |
|||||||
(in millions) |
||||||||
Borrowings under senior secured credit facility, carrying value |
$ |
$ |
||||||
|
||||||||
|
— | |||||||
|
||||||||
Other |
||||||||
|
|
|
|
|||||
Total |
||||||||
Less: current portio n |
||||||||
|
|
|
|
|||||
Long-term portion |
$ | $ | ||||||
|
|
|
|
Percentage |
||||
2022 |
% | |||
2023 |
% | |||
2024 and thereafter |
% |
Percentage |
||||
2021 |
% | |||
2022 |
% | |||
2023 and thereafter |
% |
Principal Payments | |||||
(in millions) | |||||
2021 |
|
$ | |||
2022 |
|
||||
2023 |
|
||||
2024 |
|
||||
2025 |
|
||||
Thereafter |
|
||||
|
|
|
|||
Total |
|
$ | |||
|
|
|
Changes in Accumulated Other Comprehensive Loss by Component | |||||||||||||||
Foreign Currency Translation Adjustments |
Unrealized Gain (Loss) on Derivatives |
Total | |||||||||||||
(in millions) | |||||||||||||||
Balance as of December 31, 2017 |
|
$ | ( |
) | |
$ | |
$ | ( |
) | |||||
Other comprehensive loss before reclassifications, net of tax |
|
( |
) | |
( |
) | |
( |
) | ||||||
Amounts reclassified from accumulated other comprehensive loss to income, net of tax(1) |
|
— | |
|
|||||||||||
|
|
|
|
|
|
|
|
|
|||||||
Total other comprehensive loss, net of reclassifications |
|
( |
) | |
( |
) | |
( |
) | ||||||
|
|
|
|
|
|
|
|
|
|||||||
Balance as of December 31, 2018 |
|
( |
) | |
|
( |
) | ||||||||
Other comprehensive loss before reclassifications, net of tax |
|
— | |
( |
) | |
( |
) | |||||||
Amounts reclassified from accumulated other comprehensive loss to income, net of tax(1) |
|
— | |
( |
) | |
( |
) | |||||||
|
|
|
|
|
|
|
|
|
|||||||
Total other comprehensive loss, net of reclassifications |
|
— | |
( |
) | |
( |
) | |||||||
|
|
|
|
|
|
|
|
|
|||||||
Balance as of December 31, 2019 |
|
( |
) | |
( |
) | |
( |
) | ||||||
Other comprehensive income before reclassifications, net of tax |
|
|
|
||||||||||||
Amounts reclassified from accumulated other comprehensive loss to income, net of tax(1) |
|
— | |
( |
) | |
( |
) | |||||||
|
|
|
|
|
|
|
|
|
|||||||
Total other comprehensive income (loss), net of reclassifications |
|
|
( |
) | |
||||||||||
|
|
|
|
|
|
|
|
|
|||||||
Balance as of December 31, 2020 |
|
$ | ( |
) | |
$ | ( |
) | |
$ | ( |
) | |||
|
|
|
|
|
|
|
|
|
(1) | See Note 2, Basis of Presentation Derivative Instruments and Hedging Activities |
Number of Awards |
Weighted- Average Exercise Price Per Award |
Weighted- Average Remaining Contractual Term |
Aggregate Intrinsic Value(1) | |||||||||||||||||
(in thousands) |
(in millions) | |||||||||||||||||||
Outstanding as of December 31, 2019(2)(3) |
$ |
$ |
||||||||||||||||||
Grante d |
— |
$ |
— |
|||||||||||||||||
Exercised(4) |
( |
) |
$ |
|||||||||||||||||
Forfeited |
( |
) |
$ |
|||||||||||||||||
|
|
|||||||||||||||||||
Outstanding as of December 31, 2020(2)(3) |
$ |
$ |
||||||||||||||||||
|
|
|||||||||||||||||||
Exercisable as of December 31, 2020(2)(5) |
$ |
$ |
||||||||||||||||||
|
|
|||||||||||||||||||
Vested and expected to vest as of December 31, 2020 |
$ |
$ |
||||||||||||||||||
|
|
(1) | The intrinsic value is the amount by which the current market value of the underlying stock exceeds the exercise price of the stock awards. |
(2) | Includes less than |
(3) | Includes |
(4) | Includes |
(5) | Includes less than |
Number of Shares |
Weighted- Average Grant Date Fair Value Per Share | |||||||||
(in thousands) |
||||||||||
Outstanding and nonvested as of December 31, 2019(1) |
|
|
$ | |||||||
Granted(2) |
|
|
$ | |||||||
Vested (3) |
|
( |
) | |
$ | |||||
Forfeited (4) |
|
( |
) | |
$ | |||||
|
|
|
|
|||||||
Outstanding and nonvested as of December 31, 2020(1) |
|
|
$ | |||||||
|
|
|
|
|||||||
Expected to vest as of December 31, 2020( 5 ) |
|
|
$ | |||||||
|
|
|
|
(1) | Includes |
(2) | Includes |
(3) | Includes |
(4) |
Includes |
(5) | Includes |
|
Year Ended December 31, |
||||||||||||||
|
2020 |
|
2019 |
|
2018 |
||||||||||
|
(in millions) |
||||||||||||||
Net sales: |
|
|
|
||||||||||||
Primary Reporting Segment |
|
$ | |
$ | |
$ | |||||||||
China |
|
|
|
||||||||||||
|
|
|
|
|
|
|
|
|
|||||||
Total net sales |
|
$ | |
$ | |
$ | |||||||||
|
|
|
|
|
|
|
|
|
|||||||
Contribution margin(1): |
|
|
|
||||||||||||
Primary Reporting Segment |
|
$ | |
$ | |
$ | |||||||||
China(2) |
|
|
|
||||||||||||
|
|
|
|
|
|
|
|
|
|||||||
Total contribution margin |
|
$ | |
$ | |
$ | |||||||||
|
|
|
|
|
|
|
|
|
|||||||
Selling, general, and administrative expenses(2) |
|
|
|
||||||||||||
Other operating income |
|
( |
) | |
( |
) | |
( |
) | ||||||
Interest expense |
|
|
|
||||||||||||
Interest income |
|
|
|
||||||||||||
Other expense (income), net |
|
— | |
( |
) | |
|||||||||
|
|
|
|
|
|
|
|
|
|||||||
Income before income taxes |
|
|
|
||||||||||||
Income taxes |
|
|
|
||||||||||||
|
|
|
|
|
|
|
|
|
|||||||
Net income |
|
$ | |
$ | |
$ | |||||||||
|
|
|
|
|
|
|
|
|
|||||||
Net sales by product line: |
|
|
|
||||||||||||
Weight Management |
|
$ | |
$ | |
$ | |||||||||
Targeted Nutrition |
|
|
|
||||||||||||
Energy, Sports, and Fitness |
|
|
|
||||||||||||
Outer Nutrition |
|
|
|
||||||||||||
Literature, Promotional, and Other(3) |
|
|
|
||||||||||||
|
|
|
|
|
|
|
|
|
|||||||
Total net sales |
|
$ | |
$ | |
$ | |||||||||
|
|
|
|
|
|
|
|
|
|||||||
Net sales by geographic area: |
|
|
|
||||||||||||
United States |
|
$ | |
$ | |
$ | |||||||||
China |
|
|
|
||||||||||||
Mexico |
|
|
|
||||||||||||
Others |
|
|
|
||||||||||||
|
|
|
|
|
|
|
|
|
|||||||
Total net sales |
|
$ | |
$ | |
$ | |||||||||
|
|
|
|
|
|
|
|
|
(1) | Contribution margin consists of net sales less cost of sales and Royalty overrides. For the China segment, contribution margin does not include service fees to China independent service providers. |
(2) | Service fees to China independent service providers totaling $ |
(3) | Product buybacks and returns in all product categories are included in the Literature, Promotional, and Other category. |
December 31, |
||||||||||||
2020 |
2019 |
2018 |
||||||||||
(in millions) |
||||||||||||
Property, plant, and equipment, net: |
||||||||||||
United States |
$ | $ | $ | |||||||||
Foreign |
||||||||||||
|
|
|
|
|
|
|||||||
Total property, plant, and equipment, net |
$ | $ | $ | |||||||||
|
|
|
|
|
|
|||||||
Deferred tax assets: |
||||||||||||
United States |
$ | $ | $ | |||||||||
Foreign |
||||||||||||
|
|
|
|
|
|
|||||||
Total deferred tax assets |
$ | $ | $ | |||||||||
|
|
|
|
|
|
Weighted- Average Contract Rate |
Notional Amount |
Fair Value Gain (Loss) | ||||||||||||||
(in millions, except weighted-average contract rate) | ||||||||||||||||
As of December 31, 2020 |
|
|
|
|
|
|||||||||||
Buy British pound sell Euro |
|
|
|
$ | |
|
$ | |||||||||
Buy British pound sell U.S. dollar |
|
|
|
|
|
— | ||||||||||
Buy Chinese yuan sell Euro |
|
|
|
|
|
( |
) | |||||||||
Buy Chinese yuan sell U.S. dollar |
|
|
|
|
|
|||||||||||
Buy Colombian peso sell U.S. dollar |
|
|
|
|
|
— | ||||||||||
Buy Danish krone sell U.S. dollar |
|
|
|
|
|
— | ||||||||||
Buy Euro sell Australian dollar |
|
|
|
|
|
— | ||||||||||
Buy Euro sell British pound |
|
|
|
|
|
— | ||||||||||
Buy Euro sell Canadian dollar |
|
|
|
|
|
— | ||||||||||
Buy Euro sell Chilean peso |
|
|
|
|
|
( |
) | |||||||||
Buy Euro sell Hong Kong dollar |
|
|
|
|
|
— | ||||||||||
Buy Euro sell Indian rupee |
|
|
|
|
|
( |
) | |||||||||
Buy Euro sell Indonesian rupiah |
|
|
|
|
|
— | ||||||||||
Buy Euro sell Israeli shekel |
|
|
|
|
|
— | ||||||||||
Buy Euro sell Kazakhstani tenge |
|
|
|
|
|
— | ||||||||||
Buy Euro sell Malaysian ringgit |
|
|
|
|
|
— | ||||||||||
Buy Euro sell Mexican peso |
|
|
|
|
|
( |
) | |||||||||
Buy Euro sell Peruvian nuevo sol |
|
|
|
|
|
— | ||||||||||
Buy Euro sell Philippine peso |
|
|
|
|
|
— | ||||||||||
Buy Euro sell Russian ruble |
|
|
|
|
|
( |
) | |||||||||
Buy Euro sell South African rand |
|
|
|
|
|
— | ||||||||||
Buy Euro sell Taiwan dollar |
|
|
|
|
|
— | ||||||||||
Buy Euro sell Turkish lira |
|
|
|
|
|
|
|
|
|
|
|
|
|
( |
) |
Weighted- Average Contract Rate |
Notional Amount |
Fair Value Gain (Loss) | |||||||||||||
(in millions, except weighted-average contract rate) | |||||||||||||||
Buy Euro sell Vietnamese dong |
|
|
|
||||||||||||
Buy Indonesian rupiah sell U.S. dollar |
|
|
|
||||||||||||
Buy Kazakhstani tenge sell Euro |
|
|
|
— | |||||||||||
Buy Korean won sell U.S. dollar |
|
|
|
||||||||||||
Buy Mexican peso sell U.S. dollar |
|
|
|
— | |||||||||||
Buy Norwegian krone sell U.S. dollar |
|
|
|
— | |||||||||||
Buy Russian ruble sell Euro |
|
|
|
— | |||||||||||
Buy Swedish krona sell U.S. dollar |
|
|
|
— | |||||||||||
Buy Taiwan dollar sell U.S. dollar |
|
|
|
— | |||||||||||
Buy U.S. dollar sell Australian dollar |
|
|
|
— | |||||||||||
Buy U.S. dollar sell Chinese yuan |
|
|
|
( |
) | ||||||||||
Buy U.S. dollar sell Colombian peso |
|
|
|
( |
) | ||||||||||
Buy U.S. dollar sell Euro |
|
|
|
( |
) | ||||||||||
Buy U.S. dollar sell Korean won |
|
|
|
( |
) | ||||||||||
Buy U.S. dollar sell Mexican peso |
|
|
|
( |
) | ||||||||||
Buy U.S. dollar sell Philippine peso |
|
|
|
( |
) | ||||||||||
Buy U.S. dollar sell Thai baht |
|
|
|
( |
) | ||||||||||
|
|
|
|
|
|
|
|||||||||
Total forward contracts |
|
|
$ | |
$ | ||||||||||
|
|
|
|
|
|
|
Weighted- Average Contract Rate |
Notional Amount |
Fair Value Gain (Loss) | |||||||||||||
(in millions, except weighted-average contract rate) | |||||||||||||||
As of December 31, 2019 |
|
|
|
||||||||||||
Buy British pound sell Euro |
|
|
$ | |
$ | — | |||||||||
Buy British pound sell U.S. dollar |
|
|
|
||||||||||||
Buy Chinese yuan sell Euro |
|
|
|
||||||||||||
Buy Chinese yuan sell U.S. dollar |
|
|
|
||||||||||||
Buy Colombian peso sell U.S. dollar |
|
|
|
— | |||||||||||
Buy Euro sell Australian dollar |
|
|
|
— | |||||||||||
Buy Euro sell British pound |
|
|
|
( |
) | ||||||||||
Buy Euro sell Hong Kong dollar |
|
|
|
— | |||||||||||
Buy Euro sell Indonesian rupiah |
|
|
|
( |
) | ||||||||||
Buy Euro sell Korean won |
|
|
|
— | |||||||||||
Buy Euro sell Malaysian ringgit |
|
|
|
— | |||||||||||
Buy Euro sell Mexican peso |
|
|
|
( |
) | ||||||||||
Buy Euro sell Peruvian nuevo sol |
|
|
|
— | |||||||||||
Buy Euro sell Philippine peso |
|
|
|
||||||||||||
Buy Euro sell Russian ruble |
|
|
|
— | |||||||||||
Buy Euro sell South African rand |
|
|
|
— | |||||||||||
Buy Euro sell Taiwan dollar |
|
|
|
— | |||||||||||
Buy Euro sell Thai baht |
|
|
|
— | |||||||||||
Buy Euro sell U.S. dollar |
|
|
|
||||||||||||
Buy Euro sell Vietnamese dong |
|
|
|
( |
) | ||||||||||
Buy Indonesian rupiah sell U.S. dollar |
|
|
|
||||||||||||
Buy Norwegian krone sell U.S. dollar |
|
|
|
— | |||||||||||
Buy Swedish krona sell U.S. dollar |
|
|
|
— | |||||||||||
Buy Taiwan dollar sell U.S. dollar |
|
|
|
— | |||||||||||
Buy U.S. dollar sell Colombian peso |
|
|
|
— | |||||||||||
Buy U.S. dollar sell Euro |
|
|
|
( |
) | ||||||||||
Buy U.S. dollar sell Mexican peso |
|
|
|
( |
) | ||||||||||
|
|
|
|
|
|
|
|||||||||
Total forward contracts |
|
|
$ | |
$ | ||||||||||
|
|
|
|
|
|
|
Amount of Gain (Loss) Recognized in Other Comprehensive Income (Loss) Year Ended December 31, | |||||||||||||||
2020 |
2019 |
2018 | |||||||||||||
(in millions) | |||||||||||||||
Derivatives designated as hedging instruments: |
|
|
|
||||||||||||
Foreign exchange currency contracts relating to inventory and intercompany management fee hedges |
|
$ | |
$ | ( |
) | |
$ | ( |
) | |||||
Interest rate swaps |
|
( |
) | |
— | |
— |
Location and Amount of Gain (Loss) Recognized in Income on Cash Flow Hedging Relationships | |||||||||||||||
Year Ended December 31, | |||||||||||||||
2020 | |||||||||||||||
Cost of sales |
Selling, general, and administrative expenses |
Interest expense | |||||||||||||
(in millions) | |||||||||||||||
Total amounts presented in the consolidated statements of income |
$ |
$ |
$ |
||||||||||||
Foreign exchange currency contracts relating to inventory hedges: |
|||||||||||||||
Amount of gain reclassified from accumulated other comprehensive loss to income |
— |
— |
|||||||||||||
Amount of loss excluded from assessment of effectiveness recognized in income(1) |
( |
) |
— |
— |
|||||||||||
Foreign exchange currency contracts relating to intercompany management fee hedges: |
|||||||||||||||
Amount of loss reclassified from accumulated other comprehensive loss to income |
— |
( |
) |
— |
|||||||||||
Amount of gain excluded from assessment of effectiveness recognized in income |
— |
— |
|||||||||||||
Interest rate swaps: |
|||||||||||||||
Amount of loss reclassified from accumulated other comprehensive loss to income |
— |
— |
( |
) | |||||||||||
Amount of gain excluded from assessment of effectiveness recognized in income |
— |
— |
— |
Location and Amount of (Loss) Gain Recognized in Income on Cash Flow Hedging Relationships | |||||||||||||||
Year Ended December 31, | |||||||||||||||
2019 | |||||||||||||||
Cost of sales |
Selling, general, and administrative expenses |
Interest expense | |||||||||||||
(in millions) | |||||||||||||||
Total amounts presented in the consolidated statements of income |
$ |
$ |
$ |
||||||||||||
Foreign exchange currency contracts relating to inventory hedges: |
|||||||||||||||
Amount of loss reclassified from accumulated other comprehensive loss to income |
( |
) |
— |
— |
|||||||||||
Amount of loss excluded from assessment of effectiveness recognized in income(1) |
( |
) |
— |
— |
|||||||||||
Foreign exchange currency contracts relating to intercompany management fee hedges: |
|||||||||||||||
Amount of gain reclassified from accumulated other comprehensive loss to income |
— |
— |
|||||||||||||
Amount of gain excluded from assessment of effectiveness recognized in income |
— |
— |
|||||||||||||
Interest rate swaps: |
|||||||||||||||
Amount of gain reclassified from accumulated other comprehensive loss to income |
— |
— |
— |
||||||||||||
Amount of gain excluded from assessment of effectiveness recognized in income |
— |
— |
— |
Location and Amount of Gain (Loss) Recognized in Income on Cash Flow Hedging Relationships | |||||||||||||||
Year Ended December 31, | |||||||||||||||
2018 | |||||||||||||||
Cost of sales |
Selling, general, and administrative expenses |
Interest expense | |||||||||||||
(in millions) | |||||||||||||||
Total amounts presented in the consolidated statements of income |
$ |
$ |
$ |
||||||||||||
Foreign exchange currency contracts relating to inventory hedges: |
|||||||||||||||
Amount of gain reclassified from accumulated other comprehensive loss to income |
— |
— |
|||||||||||||
Amount of loss excluded from assessment of effectiveness recognized in income(1) |
— |
( |
) |
— |
|||||||||||
Foreign exchange currency contracts relating to intercompany management fee hedges: |
|||||||||||||||
Amount of loss reclassified from accumulated other comprehensive loss to income |
— |
( |
) |
— |
|||||||||||
Amount of gain excluded from assessment of effectiveness recognized in income |
— |
— |
Location and Amount of Gain (Loss) Recognized in Income on Cash Flow Hedging Relationships | |||||||||||||||
Year Ended December 31, | |||||||||||||||
2018 | |||||||||||||||
Cost of sales |
Selling, general, and administrative expenses |
Interest expense | |||||||||||||
(in millions) | |||||||||||||||
Interest rate swaps: |
|||||||||||||||
Amount of gain reclassified from accumulated other comprehensive loss to income |
— |
— |
— |
||||||||||||
Amount of gain excluded from assessment of effectiveness recognized in incom e |
— |
— |
— |
(1) |
As a result of adopting ASU 2017-12 during the first quarter of 2019, for the years ended December 31, 2020 and 2019, the Company recognized gains (losses) excluded from the assessment of effectiveness on foreign exchange currency contracts relating to inventory hedges in cost of sales within its consolidated statements of income. Prior to the adoption of ASU 2017-12, for the year ended December 31, 2018, the Company recognized gains (losses) excluded from the assessment of effectiveness on foreign exchange currency contracts relating to inventory hedges in selling, general, and administrative expenses within its consolidated statement of income. |
Amount of Gain (Loss) Recognized in Income |
||||||||||||||
Year Ended December 31, |
||||||||||||||
2020 |
2019 |
2018 |
Location of Gain (Loss) Recognized in Income | |||||||||||
(in millions) |
||||||||||||||
Derivatives not designated as hedging instruments: |
||||||||||||||
Foreign exchange currency contracts |
$ | $ | $ | ( |
) | Selling, general, and administrative expenses |
Year Ended December 31, |
||||||||||||
2020 |
2019 |
2018 |
||||||||||
(in millions) |
||||||||||||
Domestic |
$ | $ | $ | ( |
) | |||||||
Foreign |
||||||||||||
|
|
|
|
|
|
|||||||
Total |
$ | $ | $ | |||||||||
|
|
|
|
|
|
Year Ended December 31, |
||||||||||||
2020 |
2019 |
2018 |
||||||||||
(in millions) |
||||||||||||
Current |
||||||||||||
Foreign |
$ | $ | $ | |||||||||
Federal |
||||||||||||
State |
||||||||||||
|
|
|
|
|
|
|||||||
|
|
|
|
|
|
|||||||
Deferred: |
||||||||||||
Foreign |
( |
) | ( |
) | ||||||||
Federal |
||||||||||||
State |
( |
) | ||||||||||
|
|
|
|
|
|
|||||||
( |
) | |||||||||||
|
|
|
|
|
|
|||||||
$ | $ | $ | ||||||||||
|
|
|
|
|
|
December 31, |
||||||||
2020 |
2019 |
|||||||
(in millions) |
||||||||
Deferred income tax assets: |
||||||||
Accruals not currently deductible |
$ | $ | ||||||
Tax loss and credit carryforwards of certain foreign subsidiaries |
||||||||
Tax loss and domestic tax credit carryforwards |
||||||||
Deferred compensation plan |
||||||||
Deferred interest expense |
||||||||
Accrued vacation |
||||||||
Inventory reserve |
||||||||
Operating lease liabilities |
||||||||
Other |
||||||||
|
|
|
|
|||||
Gross deferred income tax assets |
||||||||
Less: valuation allowance |
( |
) | ( |
) | ||||
|
|
|
|
|||||
Total deferred income tax assets |
$ | $ | ||||||
|
|
|
|
|||||
Deferred income tax liabilities: |
||||||||
Intangible assets |
$ | $ | ||||||
Depreciation/amortization |
||||||||
Unremitted foreign earnings |
||||||||
Operating lease assets |
||||||||
Other |
||||||||
|
|
|
|
|||||
Total deferred income tax liabilities |
||||||||
|
|
|
|
|||||
Total net deferred tax assets |
$ | $ | ||||||
|
|
|
|
Year Ended December 31, |
||||||||||||
2020 |
2019 |
2018 |
||||||||||
(in millions) |
||||||||||||
Tax expense at United States statutory rate |
$ | $ | $ | |||||||||
Increase (decrease) in tax resulting from: |
||||||||||||
Differences between U.S. and foreign tax rates on foreign income, including withholding taxes |
( |
) | ||||||||||
U.S. tax (benefit) on foreign income, net of foreign tax credits |
( |
) | ( |
) | ( |
) | ||||||
Increase in valuation allowances |
||||||||||||
State taxes, net of federal benefit |
( |
) | ||||||||||
Unrecognized tax benefits |
( |
) | ||||||||||
Unremitted earnings |
( |
) | ( |
) | ||||||||
Excess tax benefits on equity awards |
( |
) | ( |
) | ( |
) | ||||||
Other |
||||||||||||
Total |
$ | $ | $ | |||||||||
Year Ended December 31, |
||||||||||||
2020 |
2019 |
2018 |
||||||||||
(in millions) |
||||||||||||
Beginning balance of unrecognized tax benefits |
$ | $ | $ | |||||||||
Additions for current year tax positions |
||||||||||||
Additions for prior year tax positions |
||||||||||||
Reductions for prior year tax positions |
( |
) | ( |
) | ( |
) | ||||||
Reductions for audit settlements |
( |
) | ( |
) | ( |
) | ||||||
Reductions for the expiration of statutes of limitations |
( |
) | ( |
) | ( |
) | ||||||
Changes due to foreign currency translation adjustments |
— | ( |
) | |||||||||
Ending balance of unrecognized tax benefits (excluding interest and penalties) |
||||||||||||
Interest and penalties associated with unrecognized tax benefits |
||||||||||||
Ending balance of unrecognized tax benefits (including interest and penalties) |
$ | $ | $ | |||||||||
Significant Other Observable Inputs (Level 2) Fair Value as of December 31, 2020 |
Significant Other Observable Inputs (Level 2) Fair Value as of December 31, 2019 |
Balance Sheet Location | ||||||||||
(in millions) |
||||||||||||
ASSETS: |
||||||||||||
Derivatives designated as hedging instruments: |
||||||||||||
Foreign exchange currency contracts relating to inventory and intercompany management fee hedges |
$ | — | $ | Prepaid expenses and other current assets | ||||||||
Derivatives not designated as hedging instruments: |
||||||||||||
Foreign exchange currency contracts |
Prepaid expenses and other current assets | |||||||||||
$ | $ | |||||||||||
LIABILITIES: |
||||||||||||
Derivatives designated as hedging instruments: |
||||||||||||
Foreign exchange currency contracts relating to inventory and intercompany management fee hedges |
$ | $ | Other current liabilities | |||||||||
Interest rate swaps |
— | Other current liabilities | ||||||||||
Derivatives not designated as hedging instruments: |
||||||||||||
Foreign exchange currency contracts |
Other current liabilities | |||||||||||
$ | $ | |||||||||||
Offsetting of Derivative Assets | |||||||||||||||
Gross Amounts of Recognized Assets |
Gross Amounts Offset in the Balance Sheet |
Net Amounts of Assets Presented in the Balance Sheet | |||||||||||||
(in millions) | |||||||||||||||
December 31, 2020 |
|
|
|
||||||||||||
Foreign exchange currency contracts |
|
$ | |
$ | ( |
) | |
$ | |||||||
|
|
|
|
|
|
|
|
|
|||||||
Total |
|
$ | |
$ | ( |
) | |
$ | |||||||
|
|
|
|
|
|
|
|
|
|||||||
December 31, 2019 |
|
|
|
||||||||||||
Foreign exchange currency contracts |
|
$ | |
$ | ( |
) | |
$ | |||||||
|
|
|
|
|
|
|
|
|
|||||||
Total |
|
$ | |
$ | ( |
) | |
$ | |||||||
|
|
|
|
|
|
|
|
|
Offsetting of Derivative Liabilities | |||||||||||||||
Gross Amounts of Recognized Liabilities |
Gross Amounts Offset in the Balance Sheet |
Net Amounts of Liabilities Presented in the Balance Sheet | |||||||||||||
(in millions) | |||||||||||||||
December 31, 2020 |
|
|
|
||||||||||||
Foreign exchange currency contracts |
|
$ | |
$ | ( |
) | |
$ | |||||||
Interest rate swaps |
|
|
— | |
|||||||||||
|
|
|
|
|
|
|
|
|
|||||||
Total |
|
$ | |
$ | ( |
) | |
$ | |||||||
|
|
|
|
|
|
|
|
|
|||||||
December 31, 2019 |
|
|
|
||||||||||||
Foreign exchange currency contracts |
|
$ | |
$ | ( |
) | |
$ | |||||||
|
|
|
|
|
|
|
|
|
|||||||
Total |
|
$ | |
$ | ( |
) | |
$ | |||||||
|
|
|
|
|
|
|
|
|
December 31, |
||||||||
2020 |
2019 |
|||||||
(in millions) |
||||||||
Accrued compensation |
$ | $ | ||||||
Accrued service fees to China independent service providers |
||||||||
Accrued advertising, events, and promotion expenses |
||||||||
Current operating lease liabilities |
||||||||
Advance sales deposits |
||||||||
Income taxes payable |
||||||||
Other accrued liabilities |
||||||||
|
|
|
|
|||||
Total |
$ | $ | ||||||
|
|
|
|
2020 |
2019 |
|||||||
(in millions, except per share amounts) |
||||||||
First Quarter Ended March 31 |
||||||||
Net sales |
$ | $ | ||||||
Gross profit |
||||||||
Net income |
||||||||
Earnings per share: |
||||||||
Basic |
$ | $ | ||||||
Diluted |
$ | $ | ||||||
Second Quarter Ended June 30 |
||||||||
Net sales |
$ | $ | ||||||
Gross profit |
||||||||
Net income |
||||||||
Earnings per share: |
||||||||
Basic |
$ | $ | ||||||
Diluted |
$ | $ |
Third Quarter Ended September 30 |
||||||||
Net sales |
$ | $ | ||||||
Gross profit |
||||||||
Net income |
||||||||
Earnings per share: |
||||||||
Basic |
$ | $ | ||||||
Diluted |
$ | $ | ||||||
Fourth Quarter Ended December 31(1) |
||||||||
Net sales |
$ | $ | ||||||
Gross profit |
||||||||
Net income |
||||||||
Earnings per share: |
||||||||
Basic |
$ | $ | ||||||
Diluted |
$ | $ |
(1) | The fourth quarter of 2019 includes a net favorable adjustment to our unrecognized tax benefit liability of $ Contingencies |
Item 16. |
Form 10-K Summary |
HERBALIFE NUTRITION LTD. | ||
By: | /s/ ALEXANDER AMEZQUITA | |
Alexander Amezquita | ||
Chief Financial Officer |
Signature |
Title |
Date | ||
/s/ DR. JOHN O. AGWUNOBI |
Chairman of the Board and Chief |
February 17, 2021 | ||
Dr. John O. Agwunobi | Executive Officer |
|||
(Principal Executive Officer and Director) | ||||
/s/ ALEXANDER AMEZQUITA |
Chief Financial Officer |
February 17, 2021 | ||
Alexander Amezquita | (Principal Financial Officer) |
|||
/s/ JEHANGIR IRANI |
Senior Vice President, Principal |
February 17, 2021 | ||
Jehangir “Bobby” Irani | Accounting Officer |
|||
(Principal Accounting Officer) | ||||
/s/ RICHARD H. CARMONA |
Director | February 17, 2021 | ||
Richard H. Carmona | ||||
/s/ ALAN LEFEVRE |
Director | February 17, 2021 | ||
Alan LeFevre | ||||
/s/ JUAN MIGUEL MENDOZA |
Director | February 17, 2021 | ||
Juan Miguel Mendoza | ||||
/s/ MICHAEL MONTELONGO |
Director | February 17, 2021 | ||
Michael Montelongo | ||||
/s/ MARIA OTERO |
Director | February 17, 2021 | ||
Maria Otero | ||||
/s/ MARGARITA PALÁU-HERNÁNDEZ |
Director | February 17, 2021 | ||
Margarita Paláu-Hernández | ||||
/s/ JOHN TARTOL |
Director | February 17, 2021 | ||
John Tartol |